Ref:
Question 5 : classroom given by atiq vi
Given the exam marks of 10 students in the scale of 20 as follows:
18, 15, 12, 6, 8, 2, 3, 5, 20, 10
A student who got 12, how much better than the others in the exam?
Ans
BEST for normal distribution:
- https://www.statisticshowto.datasciencecentral.com/probability-and-statistics/normal-distributions/
- https://www.mathsisfun.com/data/standard-normal-distribution.html
Properties of a normal distribution
- The mean, mode and median are all equal.
- The curve is symmetric at the center (i.e. around the mean, μ).
- Exactly half of the values are to the left of center and exactly half the values are to the right.
- The total area under the curve is 1.
The Standard Normal Model
A standard normal model is a normal distribution with a mean of 1 and a standard deviation of 1.
Standard Normal Model: Distribution of Data
One way of figuring out how data are distributed is to plot them in a
graph. If the data is evenly distributed, you may come up with a
bell curve.
A bell curve has a small percentage of the points on both tails and the
bigger percentage on the inner part of the curve. In the
standard normal model,
about 5 percent of your data would fall into the “tails” (colored
darker orange in the image below) and 90 percent will be in between. For
example, for test scores of students, the normal distribution would
show 2.5 percent of students getting
very low scores and 2.5 percent getting
very
high scores. The rest will be in the middle; not too high or too low.
The shape of the standard normal distribution looks like this:
Practical Applications of the Standard Normal Model
The standard normal distribution could help you figure out which
subject you are getting good grades in and which subjects you have to
exert more effort into due to low scoring percentages. Once you get a
score in one subject that is higher than your score in another subject,
you might think that you are better in the subject where you got the
higher score. This is not always true.
You can only say that you are better in a particular subject if you
get a score with a certain number of standard deviations above the mean.
The standard deviation tells you how tightly your data is clustered
around the mean; It allows you to compare different distributions that
have different types of data — including different means.
For example, if you get a score of 90 in Math and 95 in English, you
might think that you are better in English than in Math. However, in
Math, your score is 2 standard deviations above the mean. In English,
it’s only one standard deviation above the mean. It tells you that in
Math, your score is far higher than most of the students (your score
falls into the tail).
Based on this data, you actually performed better in Math than in English!
Probability Questions using the Standard Model
Questions about standard normal distribution probability can
look
alarming but the key to solving them is understanding what the area
under a standard normal curve represents. The total area under a
standard normal distribution curve is 100% (that’s “1” as a decimal).
For example, the left half of the curve is 50%, or .5. So the
probability of a random variable appearing in the left half of the curve
is .5.
Of course, not all problems are quite
that simple, which is why there’s a
z-table. All a z-table does is measure those probabilities (i.e. 50%) and put them in
standard deviations from the
mean. The mean is in the center of the standard normal distribution, and a probability of 50% equals zero standard deviations.
Standard normal distribution: How to Find Probability (Steps)
Step 1: Draw a
bell curve and shade in the area that is asked for in the question. The
example below shows z >-0.8. That means you are looking for the
probability that z is greater than -0.8, so you need to draw a vertical
line at -0.8 standard deviations from the mean and shade everything
that’s greater than that number.

shaded area is z > -0.8
Step 2: Visit the
normal probability area index and
find a picture that looks like your graph. Follow the instructions on
that page to find the z-value for the graph. The z-value
is the probability.
Tip: Step 1 is technically optional, but it’s
always
a good idea to sketch a graph when you’re trying to answer probability
word problems. That’s because most mistakes happen not because you can’t
do the math or read a z-table, but because you subtract a
z-score
instead of adding (i.e. you imagine the probability under the curve in
the wrong direction. A sketch helps you cement in your head exactly what
you are looking for.
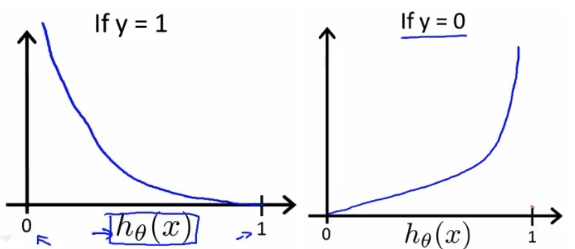
 Differential w.r.t to w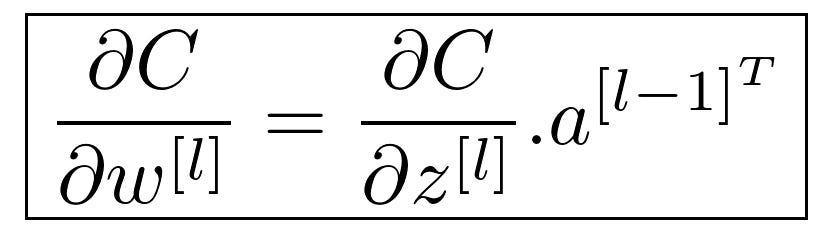
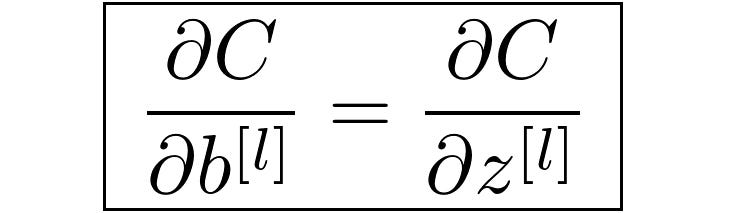 above equation based on Andrew Ng video
 WE need to care about NN sign to understand the equation. Andrew ng and midium NN presention(W,Z, layer lonation different) different presentatin.