Tuesday, November 26, 2019

Support Vector Machine (SVM)


REF:
  1. https://blog.statsbot.co/support-vector-machines-tutorial-c1618e635e93 (***) (very very important ... describe elaborately)
  2. https://www.quora.com/Why-is-a-support-vector-machine-called-a-machine (Why added machine in the last)
  3. https://www.youtube.com/watch?v=g8D5YL6cOSE
  4. https://towardsdatascience.com/support-vector-machine-introduction-to-machine-learning-algorithms-934a444fca47 ( svm algorithm and python code )  
  5. https://www.analyticsvidhya.com/blog/2017/09/understaing-support-vector-machine-example-code/ (to understand pros and crons) 
  6. https://en.wikipedia.org/wiki/Support-vector_machine (there lot of algorithm description ) 
  7. https://data-flair.training/blogs/svm-support-vector-machine-tutorial/ (SVM algorithm and python code)
  8. https://github.com/llSourcell/Classifying_Data_Using_a_Support_Vector_Machine/blob/master/support_vector_machine_lesson.ipynb (descripted by siraj svm and python code VVVVVI  easily understandabe  / https://www.youtube.com/watch?v=g8D5YL6cOSE) (for coding purpose see ref 4)
  9. https://towardsdatascience.com/support-vector-machines-intuitive-understanding-part-1-3fb049df4ba1 ( *******)
  10. https://towardsdatascience.com/support-vector-machines-svm-c9ef22815589 (basic idea about svm
  11. https://medium.com/stupid-simple-ai-series/svm-and-kernel-svm-fed02bef1200

---------------------------------- vvvi start for SVM linear--------------------------------------

BOOK (andru ng book)
http://cs229.stanford.edu/notes/cs229-notes3.pdf

https://towardsdatascience.com/understanding-support-vector-machine-part-1-lagrange-multipliers-5c24a52ffc5e (important for understanding svm using legrance multiplier) (VVVVVI **************)(must read)

******************* ak sathe
https://www.youtube.com/watch?v=qF0aDJfEa4Y (convex optimization need to see before starting svm)
https://www.youtube.com/watch?v=05VABNfa1ds (describe the max W^2 (W square)) (VVVI )
https://www.youtube.com/watch?v=wBVSbVktLIY (Kernel tricks)
*********************

https://www.youtube.com/watch?v=_PwhiWxHK8o&t=1368s (boss video please to see this)

https://mccormickml.com/2013/04/16/trivial-svm-example/ (svm scoring function ******************)

https://towardsdatascience.com/support-vector-machines-svm-c9ef22815589 (basic idea about svm) (try to understand the soft margin(it about C) and hard margin )

https://towardsdatascience.com/support-vector-machine-introduction-to-machine-learning-algorithms-934a444fca47 ( svm algorithm and python code )  (this code is important for understanding matrix coding, not need to show siraj code )


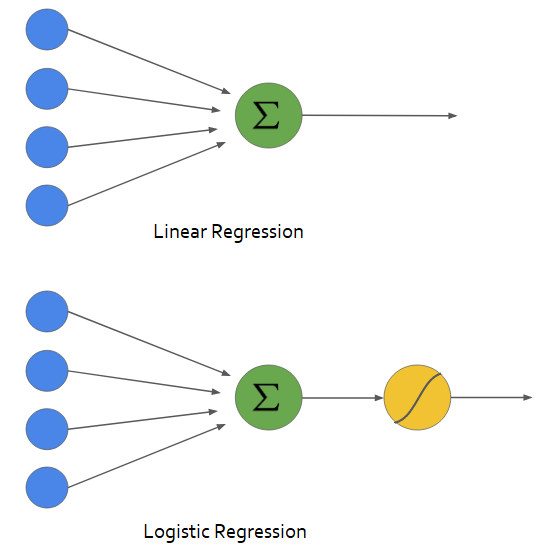
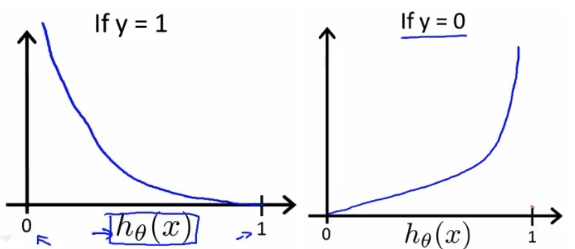
In logistic regression, we take the output of the linear function and squash the value within the range of [0,1] using the sigmoid function. If the squashed value is greater than a threshold value(0.5) we assign it a label 1, else we assign it a label 0. In SVM, we take the output of the linear function and if that output is greater than 1, we identify it with one class and if the output is -1, we identify is with another class. Since the threshold values are changed to 1 and -1 in SVM, we obtain this reinforcement range of values([-1,1]) which acts as margin.


understanding the cost function in SVM, just read the second part out of three part. it's describe better. (statement is ok)


So now comes the next question, what causes SVM to maximize the margin ‘m’ ? The answer lies in optimizing the cost/ loss function that was discussed in Part #1.


(**************** it has three part )
  1. https://towardsdatascience.com/support-vector-machines-intuitive-understanding-part-1-3fb049df4ba1 (part 1)
  2. https://towardsdatascience.com/support-vector-machines-intuitive-understanding-part-2-1046dd449c59 (part 2)
  3. https://www.intmath.com/plane-analytic-geometry/perpendicular-distance-point-line.php (perpendicular distance equation proved) 
  4. https://www.freemathhelp.com/numerator-denominator.html (denominator
  5. diverges just opposite of converge which means same value will not generate after some time.

 Normalization:

The word “normalization” is used informally in statistics, and so the term normalized data can have multiple meanings. In most cases, when you normalize data you eliminate the units of measurement for data, enabling you to more easily compare data from different places

Weights can be adjusted by dividing the weight by the mean of weights. The relative values of the weights are not changed, but they are adjusted so that the mean is 1, and the sum of weights equals the N of cases 


(Andru Ng lecture about Support vector machine) (**********************)
  1. https://www.youtube.com/watch?v=hCOIMkcsm_g&list=PLNeKWBMsAzboNdqcm4YY9x7Z2s9n9q_Tb


(** very important) (high thought - a lot of mathematical term)
  1. Video Lectures: Learning from Data by Yaser Abu-Mostafa. Lectures from 14 to 16 talk about SVMs and kernels. I’d also highly recommend the whole series if you’re looking for an introduction to ML, it maintains an excellent balance between math and intuition.
  2. Book: The Elements of Statistical Learning — Trevor Hastie, Robert Tibshirani, Jerome Friedman.Chapter 4 introduces the basic idea behind SVMs, while Chapter 12 deals with it comprehensively.


SUPORT vector machine implementation:
  1.  https://www.codeproject.com/Articles/1267445/An-Introduction-to-Support-Vector-Machine-SVM-and
  2.  https://mccormickml.com/2013/04/16/trivial-svm-example/  
  3. https://en.wikipedia.org/wiki/Sequential_minimal_optimization (SMO  descripotion better) 
  4. http://cs229.stanford.edu/materials/smo.pdf (description + code vvvvviiiiii) 
  5. https://shuzhanfan.github.io/2018/05/understanding-mathematics-behind-support-vector-machines/ (boss theory) 
  6. http://www.ccs.neu.edu/home/vip/teach/MLcourse/6_SVM_kernels/lecture_notes/svm/svm.pdf (A to Z about svm) 
  7. https://www.pyimagesearch.com/2016/09/05/multi-class-svm-loss/ (According to rossi san example)


https://towardsdatascience.com/common-loss-functions-in-machine-learning-46af0ffc4d23 (Hindge loss ***********************)
---------------------------------- vvvi end for SVM linear--------------------------------------


----------------------------------  start for SVM non linear info--------------------------------------

Ref:
  1. https://www.geeksforgeeks.org/ml-using-svm-to-perform-classification-on-a-non-linear-dataset/  (example with figure and scikit code)
  2. https://www.kdnuggets.com/2016/06/select-support-vector-machine-kernels.html 
  3. https://towardsdatascience.com/support-vector-machines-svm-c9ef22815589 (basic idea about svm)

Why kernel is important:
https://towardsdatascience.com/kernel-function-6f1d2be6091 (VVI ***) (

How does it work? please read this section

)

In machine learning, a “kernel” is usually used to refer to the kernel trick, a method of using a linear classifier to solve a non-linear problem.


SVM algorithms use a set of mathematical functions that are defined as the kernel. The function of kernel is to take data as input and transform it into the required form. Different SVM algorithms use different types of kernel functions. These functions can be different types. For example linear, nonlinear, polynomial, radial basis function (RBF), and sigmoid.

ref: https://data-flair.training/blogs/svm-kernel-functions/


MAin Kernel: (https://www.youtube.com/watch?v=FCUBwP-JTsA&list=PLNeKWBMsAzboNdqcm4YY9x7Z2s9n9q_Tb&index=6) (this video discuss about how to use kernel and compare the logistic regression and svm) (must watch)
  • linear kernel (no kernel)
    1. when feature/ column large then use linear kernel.
    2. linear kernel is called no kernel. that means that  time don't change the dimention
  • Gaussian kernel / Radial basis funtion (RBF) kernel 
    • when feature is less but data is huge then use gaussian kernel 
    • Do perform feature scaling before implementing Gaussian kernel
*** Do perform feature scaling before implementing Gaussian kernel


many off-the-shelf-kernel:
  • polynomial
  • string kernel 
  • chi square kernel
  • histogram intersection kernel


Gaussian kernel

  1. https://datascience.stackexchange.com/questions/17352/why-do-we-use-a-gaussian-kernel-as-a-similarity-metric (why measure exponential similarity)
  2. use feature scalling before using gaussian kernel

Thursday, November 21, 2019

Hypothesis null, alternate and normal distribution

Ref:

Question 5 : classroom given by atiq vi
Given the exam marks of 10 students in the scale of 20 as follows:
18, 15, 12, 6, 8, 2, 3, 5, 20, 10
A student who got 12, how much better than the others in the exam?


Ans


BEST for normal distribution:
  1. https://www.statisticshowto.datasciencecentral.com/probability-and-statistics/normal-distributions/ 
  2. https://www.mathsisfun.com/data/standard-normal-distribution.html

Properties of a normal distribution

  • The mean, mode and median are all equal.
  • The curve is symmetric at the center (i.e. around the mean, μ).
  • Exactly half of the values are to the left of center and exactly half the values are to the right.
  • The total area under the curve is 1.
The Standard Normal Model
A standard normal model is a normal distribution with a mean of 1 and a standard deviation of 1.

Standard Normal Model: Distribution of Data

One way of figuring out how data are distributed is to plot them in a graph. If the data is evenly distributed, you may come up with a bell curve. A bell curve has a small percentage of the points on both tails and the bigger percentage on the inner part of the curve. In the standard normal model, about 5 percent of your data would fall into the “tails” (colored darker orange in the image below) and 90 percent will be in between. For example, for test scores of students, the normal distribution would show 2.5 percent of students getting very low scores and 2.5 percent getting very high scores. The rest will be in the middle; not too high or too low. The shape of the standard normal distribution looks like this:
Standard normal model
Standard normal model. Image credit: University of Virginia.

Practical Applications of the Standard Normal Model

The standard normal distribution could help you figure out which subject you are getting good grades in and which subjects you have to exert more effort into due to low scoring percentages. Once you get a score in one subject that is higher than your score in another subject, you might think that you are better in the subject where you got the higher score. This is not always true.
You can only say that you are better in a particular subject if you get a score with a certain number of standard deviations above the mean. The standard deviation tells you how tightly your data is clustered around the mean; It allows you to compare different distributions that have different types of data — including different means.
For example, if you get a score of 90 in Math and 95 in English, you might think that you are better in English than in Math. However, in Math, your score is 2 standard deviations above the mean. In English, it’s only one standard deviation above the mean. It tells you that in Math, your score is far higher than most of the students (your score falls into the tail).
Based on this data, you actually performed better in Math than in English!

Probability Questions using the Standard Model

Questions about standard normal distribution probability can look alarming but the key to solving them is understanding what the area under a standard normal curve represents. The total area under a standard normal distribution curve is 100% (that’s “1” as a decimal). For example, the left half of the curve is 50%, or .5. So the probability of a random variable appearing in the left half of the curve is .5.
Of course, not all problems are quite that simple, which is why there’s a z-table. All a z-table does is measure those probabilities (i.e. 50%) and put them in standard deviations from the mean. The mean is in the center of the standard normal distribution, and a probability of 50% equals zero standard deviations.

Standard normal distribution: How to Find Probability (Steps)

Step 1: Draw a bell curve and shade in the area that is asked for in the question. The example below shows z >-0.8. That means you are looking for the probability that z is greater than -0.8, so you need to draw a vertical line at -0.8 standard deviations from the mean and shade everything that’s greater than that number.
standard normal distribution
shaded area is z > -0.8
Step 2: Visit the normal probability area index and find a picture that looks like your graph. Follow the instructions on that page to find the z-value for the graph. The z-value is the probability.
Tip: Step 1 is technically optional, but it’s always a good idea to sketch a graph when you’re trying to answer probability word problems. That’s because most mistakes happen not because you can’t do the math or read a z-table, but because you subtract a z-score instead of adding (i.e. you imagine the probability under the curve in the wrong direction. A sketch helps you cement in your head exactly what you are looking for.

Tuesday, November 19, 2019

Logistics Regretion


REF:
  1. https://ml-cheatsheet.readthedocs.io/en/latest/logistic_regression.html#introduction (Logistic regreation with python code )
  2. https://intellipaat.com/community/10666/why-the-cost-function-of-logistic-regression-has-a-logarithmic-expression
  3. https://www.coursera.org/learn/machine-learning/lecture/1XG8G/cost-function
  4. https://ml-cheatsheet.readthedocs.io/en/latest/logistic_regression.html#introduction
  5. https://peterroelants.github.io/posts/cross-entropy-logistic/ (VVI)
  6. https://www.youtube.com/watch?v=MztgenIfGgM (VVI)
  7.  https://stats.stackexchange.com/questions/278771/how-is-the-cost-function-from-logistic-regression-derivated (VVVI derived cost function to gradient
  8. https://www.geeksforgeeks.org/understanding-logistic-regression/  (Logistic regreation with python code )
  9. https://towardsdatascience.com/building-a-logistic-regression-in-python-301d27367c24 (logistic regration with code and data) 
  10. https://ml-cheatsheet.readthedocs.io/en/latest/loss_functions.html#loss-cross-entropy (description about cross entropy loss) 
  11. https://teddykoker.com/2019/06/multi-class-classification-with-logistic-regression-in-python/ (code multi class logistic  regression python code ************* VVVI for multi class code )

 Example : linear regression and logistic regression


Logistic Regression practice:


Cross-Entropy

Cross-entropy loss, or log loss, measures the performance of a classification model whose output is a probability value between 0 and 1

Cross entropy is a measure of how different 2 probability distributions are to each other. If p and q are discrete we have :


The benefits of taking the logarithm reveal themselves when you look at the cost function graphs for y=1 and y=0. These smooth monotonic functions [7] (always increasing or always decreasing) make it easy to calculate the gradient and minimize cost. Image from Andrew Ng’s slides on logistic regression [1].


REF:
  1.  https://ml-cheatsheet.readthedocs.io/en/latest/loss_functions.html#loss-cross-entropy
  2. https://teddykoker.com/2019/06/multi-class-classification-with-logistic-regression-in-python/ (**************)
  3. https://medium.com/@jjw92abhi/is-logistic-regression-a-good-multi-class-classifier-ad20fecf1309 (************)  
  4. https://teddykoker.com/2019/06/multi-class-classification-with-logistic-regression-in-python/ (multi class logistic  regression python code)

multiple classification for Logistic regression

Multinomial logistic regression is a form of logistic regression used to predict a target variable have more than 2 classes. It is a modification of logistic regression using the softmax function instead of the sigmoid function the cross entropy loss function. The softmax function squashes all values to the range [0,1] and the sum of the elements is 1.


https://medium.com/@jjw92abhi/is-logistic-regression-a-good-multi-class-classifier-ad20fecf1309  (Multinomial Logistic Regression)


Thursday, November 14, 2019

linear algebra, vector, linear transformation, matrix, dot product , cross product


Ref:


  dot product , cross product
  1.  https://physics.stackexchange.com/questions/333877/can-anyone-tell-me-that-actually-what-vector-multiplication-is
  2. https://physics.stackexchange.com/questions/14082/what-is-the-physical-significance-of-dot-cross-product-of-vectors-why-is-divi
  3. https://en.wikipedia.org/wiki/Dot_product
  4. https://en.wikipedia.org/wiki/Cross_product#Geometric_meaning (VVI) 
  5. https://www.youtube.com/watch?v=KDHuWxy53uM&feature=youtu.be (dot product discription ****) 
  6. https://math.stackexchange.com/questions/805954/what-does-the-dot-product-of-two-vectors-represent (see accepted answer **** )

dot product:

The dot product tells you what amount of one vector goes in the direction of another.


Cross product : (https://en.wikipedia.org/wiki/Cross_product#Geometric_meaning)

Wednesday, November 13, 2019

Principle component analysis (PCA)


PCA ref:
benefits:
  • reduce the dimension so improve the performence
  • try to keep 99% of variance  retained

Application of PCA
  • Compression
    • reduce the memory/disk need to store data
    • speed up the learning alogorithm
  •  Visualization
    • 2D/3D for visualization 

Before implemening PCA, first try running whatever you want to do with the orginal data/raw data. Only if that does not do what you want, then consiser the PCA.

Eigenvalue and EigenVector


Ref:


Eigen Vector: Eigenvector is one kind of vector that's axis is not change during linear transformation. Eigenvector is associated with eigenvalue.


fully uderstanding the eigen vector and eigen value please see this vedio:

https://www.youtube.com/watch?v=PFDu9oVAE-g&list=PLZHQObOWTQDPD3MizzM2xVFitgF8hE_ab&index=15&t=0s


  1.  unique vector 
  2. then transform to another ventor 
  3.  


Wednesday, November 6, 2019

Autoboxing and Unboxing

  Autoboxing  is the automatic conversion that the Java compiler makes between the primitive types and their corresponding object wrapper cl...