Ref:
- https://medium.com/greyatom/decision-trees-a-simple-way-to-visualize-a-decision-dc506a403aeb (basic all information ***)
- https://www.youtube.com/watch?v=nWuUahhK3Oc (*** better for understnding Regression tree)
- https://sefiks.com/2018/08/27/a-step-by-step-cart-decision-tree-example/ (here is the full example of sunny outlook exam)
- https://en.wikipedia.org/wiki/C4.5_algorithm (c4.5 algorithm)
- https://www.geeksforgeeks.org/decision-tree-introduction-example/ (gini index and entropy)
- https://www.youtube.com/watch?v=Pz6xX6rK5M4&list=PLBv09BD7ez_4_UoYeGrzvqveIR_USBEKD&index=1 (vvvi ***** clearly describe information gain)
- https://datascience.stackexchange.com/questions/24339/how-is-a-splitting-point-chosen-for-continuous-variables-in-decision-trees (Good question and answer)
- https://m.youtube.com/watch?v=OD8aO4ovIBo (continuous data or numeric data splitting boss video please sees ★*****★***★***********)
- https://www.youtube.com/watch?v=eKD5gxPPeY0 (decision tree for multiple classification)
- Here log base 3 for 3 classification for entrophy
- log base for 4 for 4 classfication for entropy
- https://medium.com/@rishabhjain_22692/decision-trees-it-begins-here-93ff54ef134 (Entropy and information gain, ID3 ************** have good example)
ID3:
- Entropy using the frequency table of one attribute:
- Entropy using the frequency table of two attributes:
-
Gini Index (see ref 5 )
Gini index says, if we select two items from a population at random then they must be of same class and probability for this is 1 if population is pure. - It works with categorical target variable “Success” or “Failure”.
- It performs only Binary splits
- Higher the value of Gini higher the homogeneity.
- CART (Classification and Regression Tree) uses Gini method to create binary splits.
Chi-Square
It is an algorithm to find out the statistical significance between the differences between sub nodes and parent node. We measure it by sum of squares of standardised differences between observed and expected frequencies of target variable.- It works with categorical target variable “Success” or “Failure”.
- It can perform two or more splits.
- Higher the value of Chi-Square higher the statistical significance of differences between sub-node and Parent node.
- Chi-Square of each node is calculated using formula,
- Chi-square = ((Actual — Expected)² / Expected)¹/2
- It generates tree called CHAID (Chi-square Automatic Interaction Detector)
-
Variance matrix :
- variance matrix important due to numerical or continuous data
Regression Trees vs Classification Trees (REF -01)
The
terminal nodes (or leaves) lies at the bottom of the decision tree.
This means that decision trees are typically drawn upside down such that
leaves are the bottom & roots are the tops.
Both
the trees work almost similar to each other. The primary differences
and similarities between Classification and Regression Trees are:
- Regression trees are used when dependent variable is continuous. Classification Trees are used when dependent variable is categorical.
- In case of Regression Tree, the value obtained by terminal nodes in the training data is the mean response of observation falling in that region. Thus, if an unseen data observation falls in that region, we’ll make its prediction with mean value.
- In case of Classification Tree, the value (class) obtained by terminal node in the training data is the mode of observations falling in that region. Thus, if an unseen data observation falls in that region, we’ll make its prediction with mode value.
- Both the trees divide the predictor space (independent variables) into distinct and non-overlapping regions.
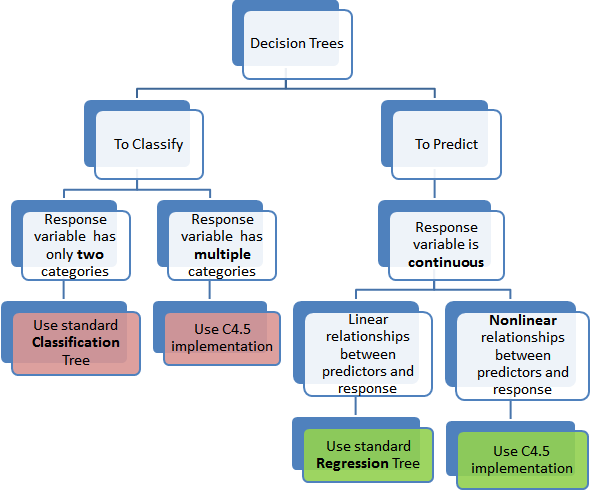
use standard classification tree: basic classification algorithm
data example:
| Day | Outlook | Temp. | Humidity | Wind | Decision |
|---|---|---|---|---|---|
| 1 | Sunny | Hot | High | Weak | No |
| 2 | Sunny | Hot | High | Strong | No |
use C4.5 implementation: https://en.wikipedia.org/wiki/C4.5_algorithm (Please study the algorithm part of this wiki)
data example:
| tutorials | labs. | exam | |||
|---|---|---|---|---|---|
| all | complete | 74 | |||
| some | partial | 23 |
use standard Regression Tree: When data is linear then, use linear regresstion . because, Decision tree not work better on linear data.
Use C4.5 Implementation: this time use the C4.5 algorithm.
| x1 | x2 | x3 | x4 | Target | |
|---|---|---|---|---|---|
| 25 | 34 | 2 | 34 | 22 | |
| 233 | 3 | 78 | 3 | 22 |
Random Forest
The random forest
is a model made up of many decision trees. Rather than just simply
averaging the prediction of trees (which we could call a “forest”), this
model uses two key concepts that gives it the name random:
- Random sampling of training data points when building trees
- Random subsets of features considered when splitting nodes
- https://www.youtube.com/watch?v=J4Wdy0Wc_xQ (Excellent video ******)
- https://www.youtube.com/watch?v=g9c66TUylZ4 (**********)
- https://www.youtube.com/watch?v=nyxTdL_4Q-Q (*******)
- https://builtin.com/data-science/random-forest-algorithm
- Overall, random forest is a (mostly) fast, simple and flexible tool, but not without some limitations (performance issue).
- https://towardsdatascience.com/an-implementation-and-explanation-of-the-random-forest-in-python-77bf308a9b76 (**** basic of random forest)
Bagging: Bootstrapping data plus using the aggregate to make a decision is called bagging
Typycally 1/3 of the original data does not end up in the bootstrap data. This 1 dataset is called out-of-bag data-set.

No comments:
Post a Comment